SpicySwap Analytics
Spicyswap has an analytics page that allows users to view and keep track of certain stats, such as: DEX volume, Total Value Locked in the DEX, stats for each token pair, stats for Spicy Fee Farming, stats for individual tokens, general DEX transaction history, etc.
Analytics Page#
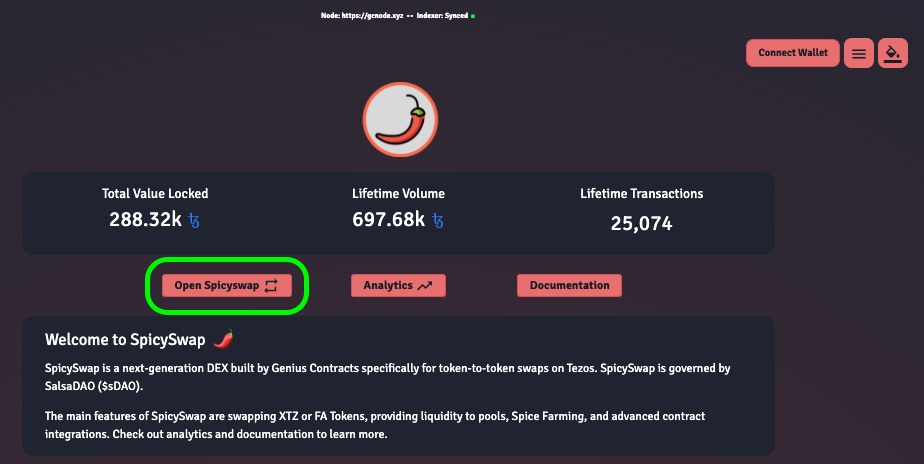
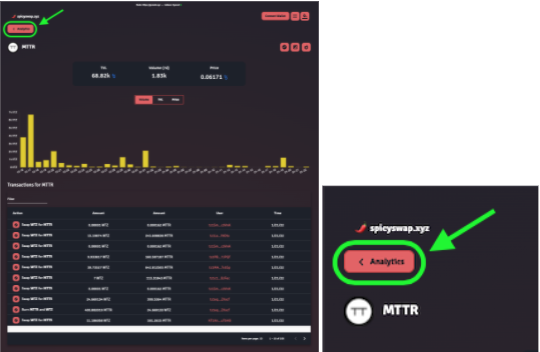
- The analytics page can be opened from the home page by clicking the ‘Analytics’ button towards the top.
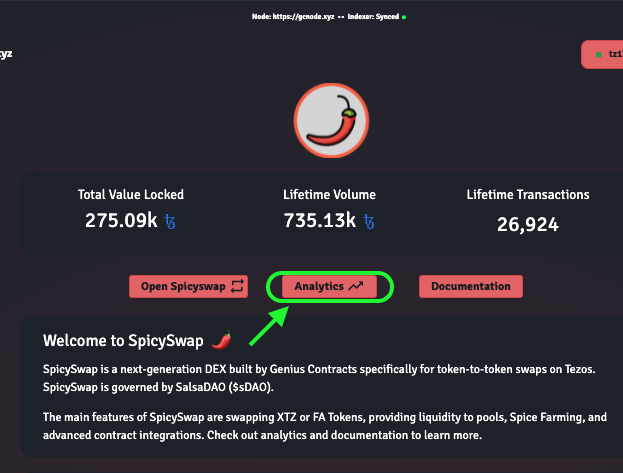
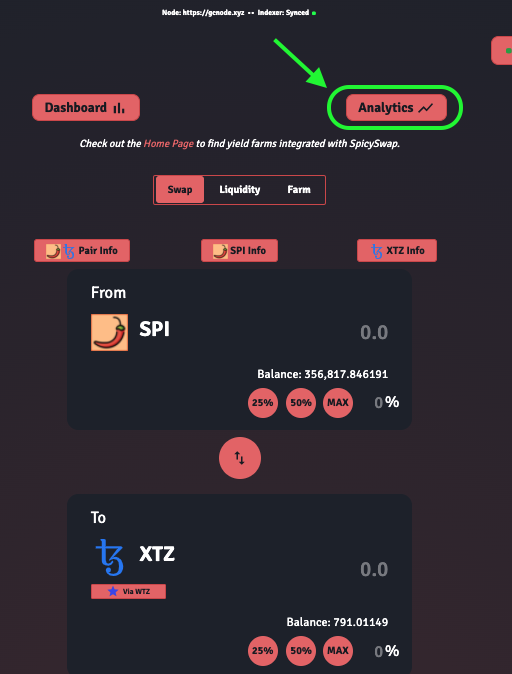
The analytics page can also be navigated to from any of the other pages upon opening Spicyswap.
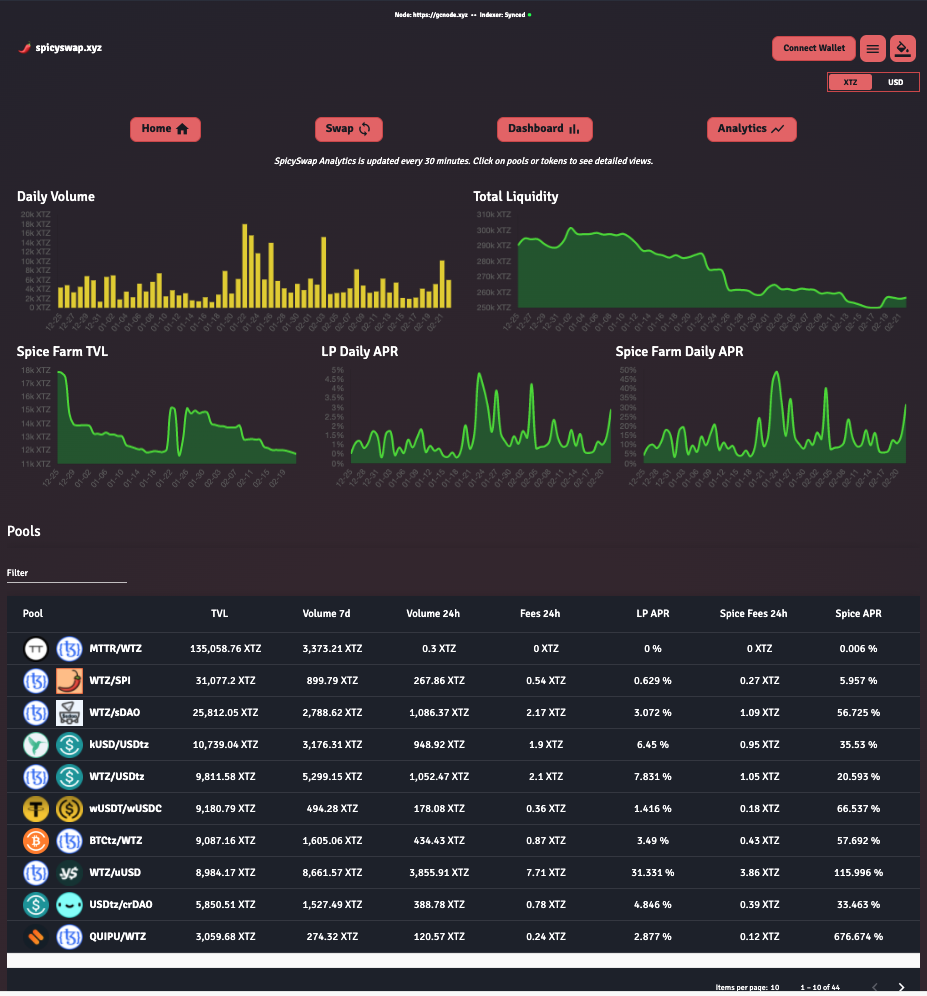
- Once you’ve navigated to the analytics page, the top half of the page will look like this:
Volume, Liquidity, & Spice Farm Stats#
At the top of the analytics page we can see 5 charts displayed. The yellow bar chart on the left is tracking total Spicyswap volume, with each bar representing the total volume for a given day (24hrs), denominated in XTZ. On the right, the green line graph represents the total value of liquidity in Spicyswap on a day to day basis (24 hrs), denominated in XTZ. And just below those there are three separate charts for Spice Farm TVL, LP Daily APR, and Spice Farm Daily APR.
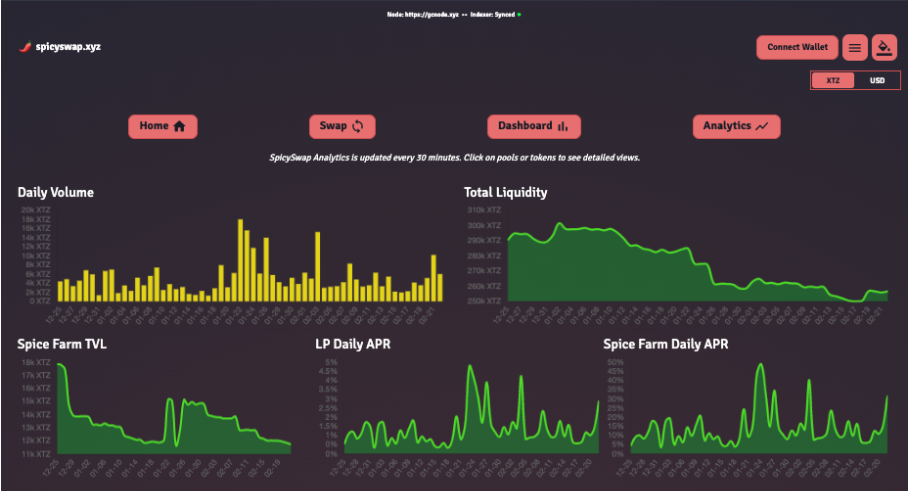
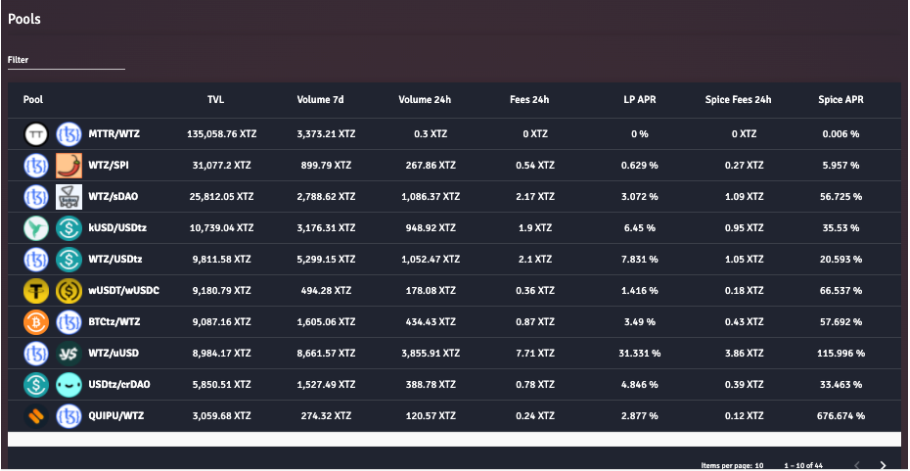
The lower half of the page shows various stats for all token pair pools on Spicswap. From left to right we can see: 1) the pair for a given pool, 2) total value locked, denominated in XTZ, 3) Volume for the pair over a 24hr period, 4) swap fees paid to liquidity providers on the pair over a 24 hr period, 5) the APR for liquidity providers on the pair, 6) the total amount of swap fees paid to the Spice Fee Farm on the pair over a 24 hr period, and 7) the APR for staking $SPI/$WTZ SSLP tokens in the Spice Fee Farm on a given pair.
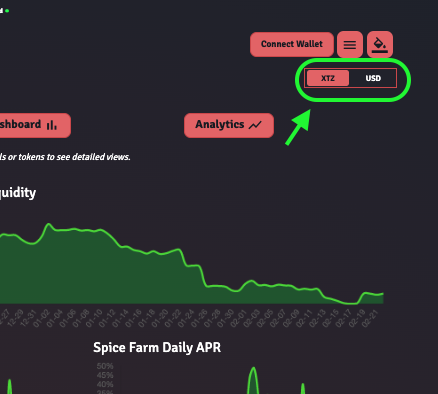
Note!
Stats can be viewed in USD metrics by toggling between XTZ & USD in the upper right hand of the analytics page.
Token Pair Stats#
- Users can navigate to the specific stats page of any pair simply by clicking the pair token symbols to the left of the Pools table:
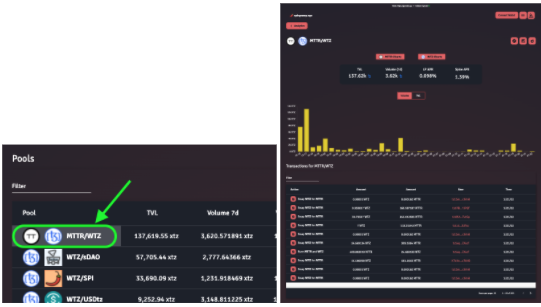
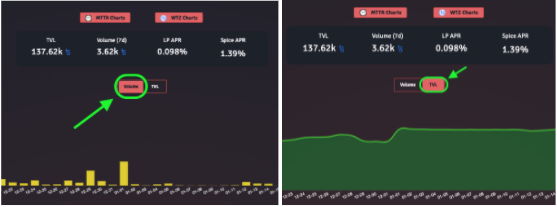
- Once on a specific token pair stats page, users can see the TVL, 7day Volume, liquidity pool APR, and Spice APR at the top of the page. Just below that, the yellow part chart tracks the volume for the pair on a 24hr basis. To see the line graph for total value lock of the pair on a day by day basis (24 hrs), toggle on the ‘TVL’ option to the right of the ‘Volume’ option.
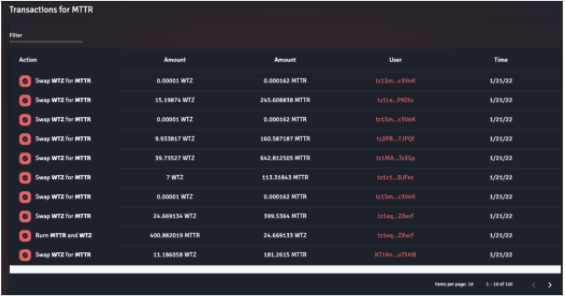
The lower part of the token pair stats page, just below the charts, tracks transactions that have been made on the pair.
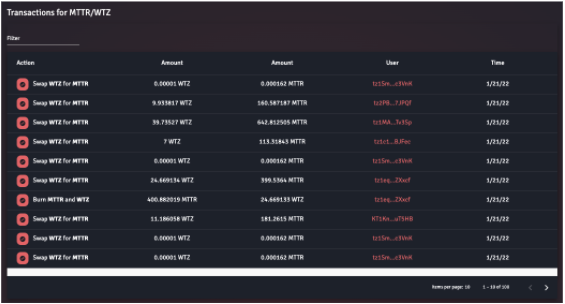
From left to right we can see: 1) what transaction was executed (e.g., Swap WTZ for MTTR; or Burn MTTR and WTZ), 2) the amount that was executed on the transaction in terms of the first token, 3) the amount that was executed on the transaction in terms of the second token, 4) the wallet address that executed the transaction, and 5) the time the transaction was executed.
Specific Token Stats#
- The stats can be made more specific for each respective token by clicking one of the ‘Charts’ buttons at the top of the page:
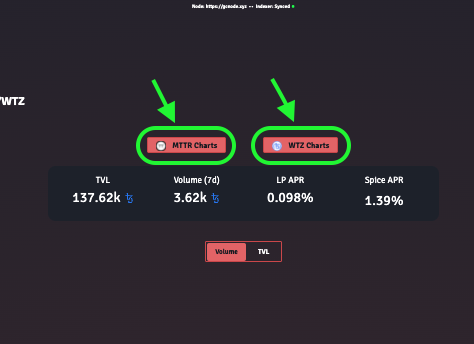
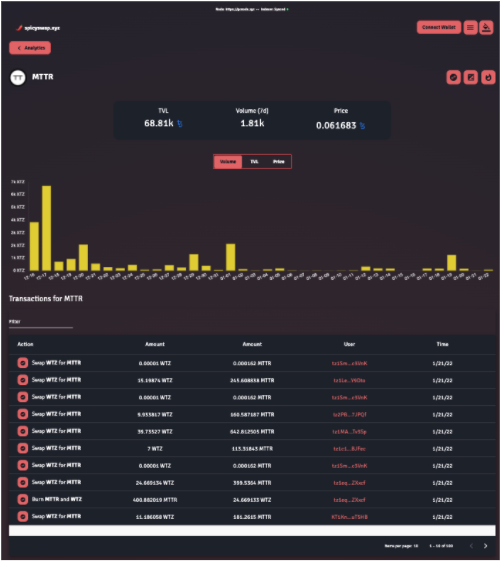
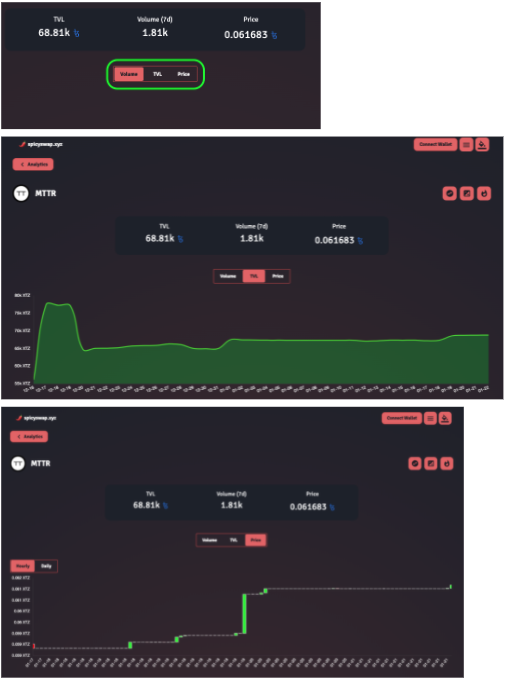
Here we see similar stats as on the previous token pair page, with the exception that users can now see the volume, total value locked, or the price of the particular token that was selected. The different charts for each of these stats can be pulled up by toggling between the various options of ‘Volume’, ‘TVL’, ‘Price'
The lower half of the token stats page displays all transactions made with this token.
Navigating the Page#
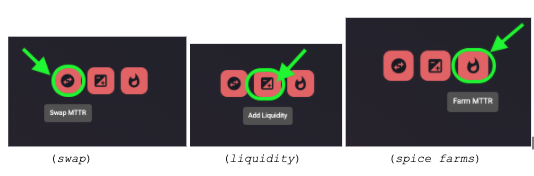
- Users will notice three untitled icons at the top right of any given stats page:
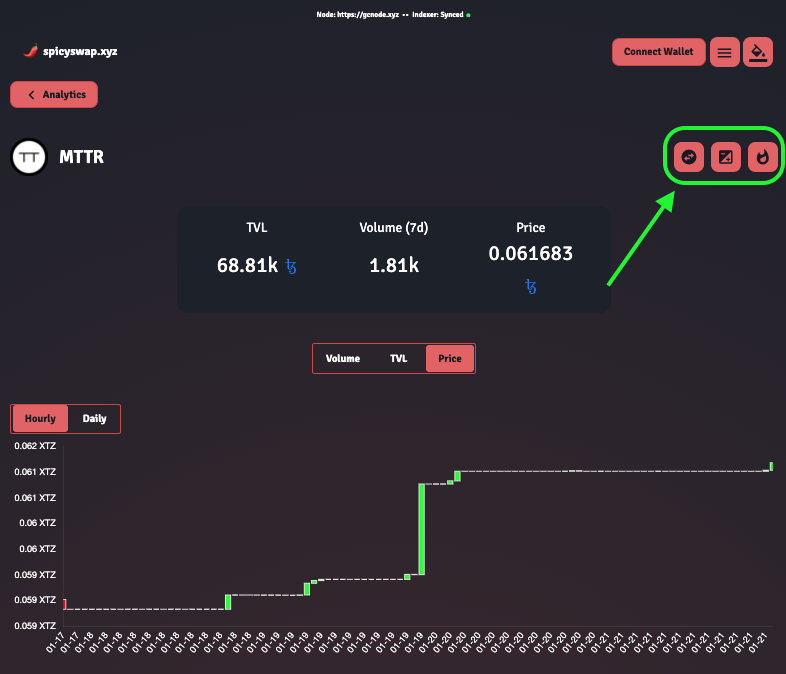
These icons are, respectively, buttons that will take you to the 1) swap page for a pair/token, 2) liquidity for a pair/token, or 3) the Spice Farm for a pair/token.
- To navigate back to the main analytics page, simply click the ‘Analytics’ button at the top left of the stats page.
Once back on the main analytics page, at the lower half of the page users can see specific tokens stats and all Spicyswap transaction activity:
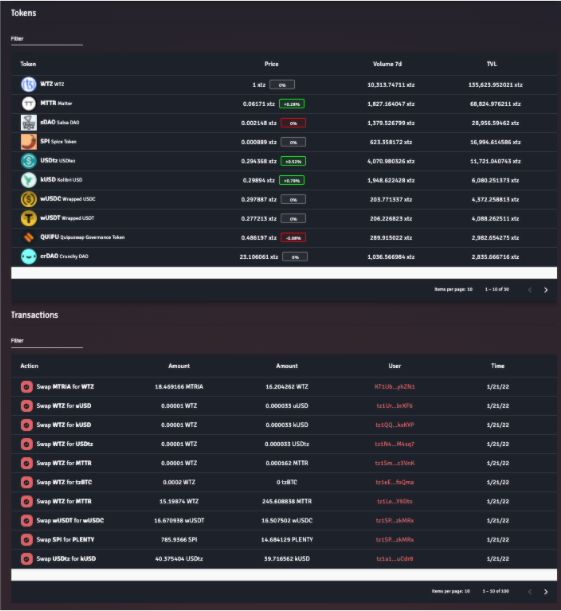
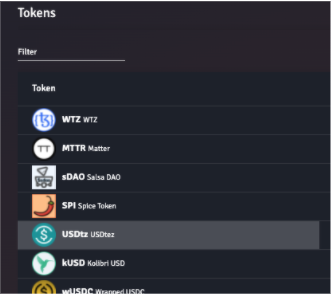
Users can navigate back to any specific token stats page by clicking the token symbol icon to the left on the Tokens table:
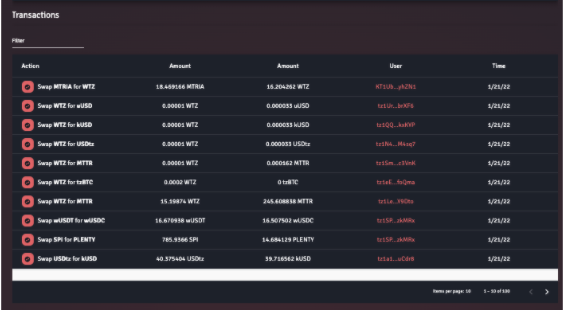
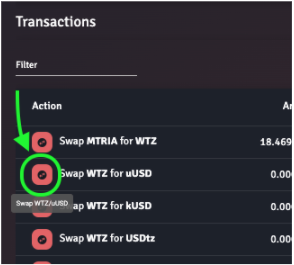
To the far left of the Transaction table, users will see an untitled swap icon which will take them to the swap page for the pair depicted in that transaction:
- Finally, on the main analytics page, users will see a ‘Dashboard’ button. By clicking ‘Dashboard’, this will navigate users to their own personal stats page:
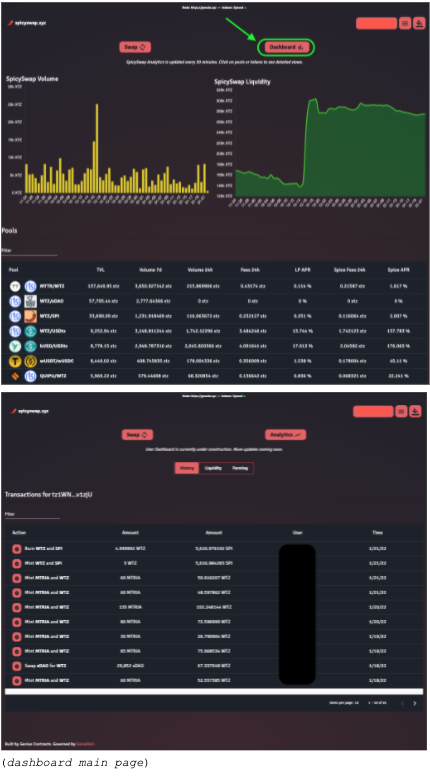
Click to next section for dashboard docs.